Aerodynamic drag is a force which can easily be approximated, but is difficult to analytically evaluate. What characteristics of the object and fluid effect aerodynamics?
-
Velocity
-
Density
-
Geometry
-
Surface Texture
This is not a comprehensive list, but it does begin to demonstrate how many variables of design should be considered to minimize the aerodynamic drag of the rocket.
SELECT TO OPTIMIZE
SOURCES USED: Citations, [6-12]
All drag analysis was completed with modeling software called OpenRocket. The equations and and information may be found in the citations.
VELOCITY
Velocity is one of the four introduced parameters that has an effect on aerodynamic drag. If we consider the elementary formula for drag, it is shown that the drag force Fd increases with the square of velocity, V.
Taking this a step further, it is known that power is equal to force times velocity.
What this means for us is that if you want to go twice as fast, you will need eight times more power, as power is proportional to the cube of velocity.
If we can find a way to decrease the drag force, we can decrease the power requirements.
There is an optimum velocity for punching through Earths atmosphere, but that is an exercise beyond the scope of this project.


DENSITY
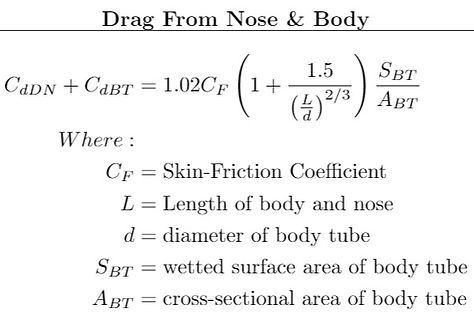
One of the few variables which governs aerodynamic drag which we do not have the means to optimize, is the density of the fluid through which our object travels. In the case of our rocket, the density of air must be considered if we are discussing the elementary drag force equation presented earlier, but also if we are considering the more precise drag coefficient equations that can be found here.
The density of air appears in the equation for the skin-friction coefficient, which is a factor considered in calculating the drag coefficients of the following sections:
-
Nose and Body Tube
-
Base
-
Fins
-
Fin Interface
As we can see, it plays a part in ALL of the drag coefficient equations, but we do not have the capability to manipulate the density.
Our only option with density is to launch on a warm day, when the air would be less dense, which would result in less resistance.
For the purpose of discussing optimization of rocket design, we are choosing to neglect the option to "wait for a warmer day", but would still like to acknowledge that it is something to consider.
INSTEAD, let's focus on the variable shown in the above equation that we can do something about.


GEOMETRY
As we have previously discussed, for the basic drag force equation, we can optimize velocity, which is a difficult task, but there is a second option; minimizing the drag coefficient.
The drag coefficient for a rocket detailed in depth here.
For now, we will consider one of the easier to control variables in an attempt to decrease the aerodynamic drag of our rocket; geometry.
The shape, size, and angles of each piece of the rocket contributes to the aerodynamic drag of the overall assembly, and there are a few design choices that can have a profound effect on decreasing the aerodynamic drag of rocket.
Let us consider three of the design choices of the rocket and examine how to optimize each of them individually.
NOSE CONE
Drag Coefficient
The aerodynamics of the nose cone, or the leading portion of rocket during flight, contribute the the greatest to the overall aerodynamic performance of the rocket. Stated simply, the more gradual the increase in diameter, the greater the rockets ability to "cut" through the air. This is why all objects that are expected to move through the air with velocity and efficiency have as small of a front profile as possible (or is reasonable).
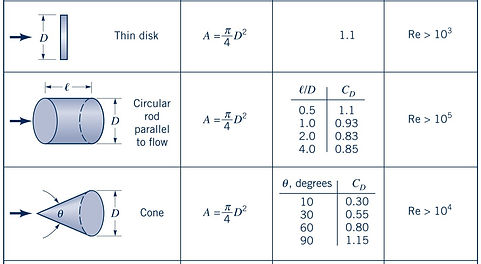
To demonstrate the importance of nose cone geometry, lets compare a two vastly different shapes. We will model the nose cone as a cone, and also consider it as blunt, flat disk. The chart to the right provides a few important values for consideration.
Immediately, the differences in drag coefficient become apparent. The thin disk has a drag coefficient of 1.1 while the drag coefficient for a cone ranges from 0.30 to 0.80 for practical nose cone applications. That is to say that simply by making the nose cone "pointy", that the drag force may be reduced by up to 115%!
The last column gives an idea of the variation in how geometry plays a role in manipulation of the Reynolds Number. A large Reynolds Number, Re, indicates that streamlines are deflected only slightly. Conversely, small values of Re indicate that streamlines greatly deflected. Greater streamline deflection results in a larger viscous effect from the fluid (greater, more turbulent drag).
OPTIMIZING OUR ROCKET
For simulation purposes, our theoretical rocket had a nose cone that could be described as a cone with an angle of 30 degrees. For approximation purposes, this geometry provided a drag coefficient of 0.55.
Focusing only on the geometry of the nosecone, we could elongate the cone to decrease the angle. As shown above, as the angle approaches 0 degrees, the drag coefficient also decreases.
We could also chose to use a smaller diameter, but that would require the body tube to be a smaller diameter as well, which is not considered for this exercise.
BODY
The body of the rocket, in our case, constitutes the greatest contribution to the rockets shape, mass, and design. Aerodynamically speaking, the body does not contribute as much to the drag coefficient as the nose cone, but the contribution that it does make should not be neglected. As we can see from the drag theory section found here, the geometry and size of the rocket can still have a significant effect. Discussion will only consider the aerodynamic contributions of the body, and not how the body effects stability or flight.
The body of the rocket makes up the greatest percentage of the rockets surface area. As this is the case, it is the most susceptible to surface finish contributions to the drag coefficient. As you would expect, a smooth finish will result in a smaller drag coefficient than would a rough surface. Further discussion on finish later.
The other major contribution is a ratio called the fineness ratio. This ratio of the length-to-diameter of the body contributes to the pressure drag experienced at the base of the rocket. This contribution can be seen in the equation to the right by the term (L/d). Optimization of this ratio varies for velocity and additional rocket geometry, but typical target values range from a ratio of 3:1 - 6:1. Other considerations such as stability, feasibility, strength and usefulness limit the ratio to a point, but discussion of that point is beyond the scope of this project.
OPTIMIZING OUR ROCKET
Dimensions of our two-liter water rocket are a body length, L of 215-mm and a diameter of 106-mm. With some rounding, the fineness ratio nears 2:1. Without using a different bottle, this is a difficult task.
Therefore, our theoretical rockets body geometry will remain.
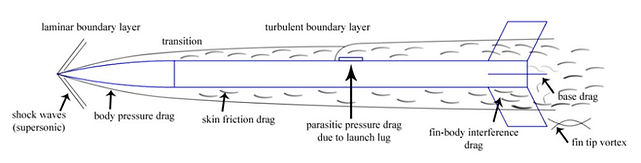
BASE
The base of the rocket, or tail, as some might call it, is likely a piece that may be neglected while designing for aerodynamics. Intuitively, this seems reasonable, as the base is not cutting through the air. Although that is true, the base design contributes significantly to the overall drag of the rocket. This drag is often referred to as base drag, or pressure drag. You may have seen large semi-truck trailers with these flimsy "fins" on the back doors? The concept is the same. Some research has shown that the addition of a taper at the base compared to that of a blunt base can decrease the drag coefficient contribution of the base by 75%, roughly a change in drag coefficient of 0.1-0.2!
Calculation of base drag is not an arbitrary task. The formula used for our composite analysis is selected for a database, and the numerator varies with geometry and style. The table to the right provides a brief description of how drastically the base can change the drag coefficient.
At a velocity of 80 km/hr, the straight body has a drag coefficient of 0.50, while at the same velocity, adding a tapered base decreased the drag coefficient to 0.35.
The term boattail is used to describe the geometry that is shown in all illustrations of our rocket.
OPTIMIZE BASE
While modeling our rocket, we chose to describe the base exactly as depicted in all of our design illustrations, with a taper from the full diameter to end of the nozzle. The fineness ratio also plays a roll here, and our idealized rocket had a base length L of 90-mm and a diameter varies from 106-mm to 27-mm, or a ratio that varies from less than one to three.
Without changing the bottle, and in a real-test, not using the modeled design, we would recreate the taper used in calculations with a lightweight and smooth material.
For the purpose of this project and drag simulation, we have decided that this different can be made negligible by rounding the simulated drag coefficients up.
SURFACE TEXTURE
Finally, we will consider how the surface texture of the rocket can effect the drag. As discussed briefly in the body optimization section, the surface texture plays a big role in how the rocket performs in flight. It is shown in the theory section here that how smooth or rough the surface of each part is, will effect every subset of total drag. Intuition should tell you that a smooth surface is optimal, which is a correct assumption. A rough surface provides more opportunity for the streamline flow to become turbulent.
A relationship can be found between relative roughness by the length, and how that relates to boundary layer flow. Derivation of this relationship is lengthy, and experimental. Summarizing the formulation can be done simply by stating that as the roughness of a surface increases, the boundary layer between laminar, transitional and turbulent flows decreases. As a result, the a rough surface means a more turbulent flow and an increase in drag.
Values for roughness are found by microscopic inspection of the material.

OPTIMIZE SURFACE TEXTURE
To decrease the impact of surface texture on drag, the texture should be as smooth as possible. For this project, a two-liter bottle made of PET could already be considered smooth. Some polishing could be done to increase the smoothness, but it is doubtful that the effort would be repaid in performance.
We chose to model the nose cone and base out of heavy paper-stock, with a roughness of 150 micrometers, while PET is considered smooth with a roughness of 20 micrometers.
We could chose a less-rough material to form the cone and base, or apply a smooth finish to both pieces.